
What is BI reporting?
BI reporting, short for Business Intelligence reporting, is a comprehensive and iterative process that plays a crucial role in empowering businesses to make informed decisions based on data analysis. It involves the gathering, cleansing, organizing, and presenting of data in a manner that facilitates effective understanding and interpretation. The objective of BI reporting is to transform raw data into meaningful insights and actionable information that can drive business growth and success.
The process begins with the collection of data from various sources such as databases, spreadsheets, cloud-based applications, and external sources. This data is then processed and cleansed to ensure accuracy and consistency. BI reporting tools employ data integration techniques to bring together data from disparate sources, eliminating data silos and enabling a holistic view of the business.
Benefits of BI reporting
The benefits of BI reporting are numerous and include:
Improved decision-making
BI reporting enables businesses to make informed decisions based on real-time data. By analyzing data and identifying trends, businesses can adjust their strategies and make decisions that drive growth.
Increased efficiency
BI reporting allows businesses to automate data collection and analysis, reducing the time and resources needed for manual data processing. This improves efficiency and allows businesses to focus on their core operations.
Enhanced data accuracy
BI reporting tools ensure data accuracy by cleaning, organizing, and validating data from various sources. This reduces errors and ensures that businesses make decisions based on reliable information.
Better communication
BI reporting tools provide visualizations and reports that are easy to understand, even for non-technical users. This improves communication and ensures that everyone in the organization has access to the same information.
BI reporting process
The BI reporting process involves the following steps:
Data collection
Data is collected from various sources, including databases, spreadsheets, and cloud-based applications.
Data cleaning and organization
The collected data is cleaned and organized to ensure accuracy and consistency.
Data analysis
The cleaned and organized data is analyzed to identify patterns, trends, and insights.
Report creation
Reports are created using BI reporting tools that provide dashboards, visualizations, and other data presentation formats.
Report distribution
Reports are distributed to stakeholders using various methods, including email, web portals, and mobile apps.
BI reporting tools
There are numerous BI reporting tools available on the market, each with its own strengths and weaknesses. Some popular tools include:
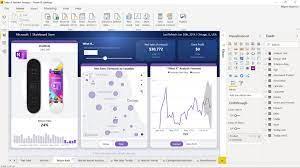
Power BI
Power BI is a cloud-based business analytics service that provides interactive visualizations and reports.
Tableau
Tableau is a data visualization and business intelligence tool that allows users to create interactive dashboards and reports.
QlikView
QlikView is a business intelligence tool that provides real-time data analysis and reporting.
SAP Business Objects
SAP Business Objects is a business intelligence suite that includes reporting, analysis, and dashboarding tools.
Types of BI reporting
There are several types of BI reporting, including:
Operational reporting
Operational reporting provides information on day-to-day operations and is used to monitor performance.
Tactical reporting
Tactical reporting provides information on specific projects or initiatives and is used to support decision-making.
Strategic reporting
Strategic reporting provides information on long-term goals and is used to guide overall business strategy.
How to create effective BI reports
To create effective BI reports, follow these best practices:
Define clear objectives
Clearly define the objectives of the report and what insights you want to gain from the data.
Choose relevant data
Select the most relevant data that aligns with your objectives and provides meaningful insights.
Use visualizations wisely
Use charts, graphs, and other visualizations to present data in a clear and concise manner.
Provide context
Provide context and explanations for the data to help users understand its significance.
Keep it user-friendly
Design reports that are user-friendly and easy to navigate, ensuring that users can find the information they need quickly.
Best practices for BI reporting
In addition to creating effective reports, there are some best practices to follow for successful BI reporting:
Ensure data quality
Maintain data quality by regularly validating, cleaning, and updating data sources.
Establish data governance
Implement data governance policies and procedures to ensure data accuracy, security, and compliance.
Train users
Provide training and support to users to ensure they understand how to use BI reporting tools effectively.
Foster collaboration
Encourage collaboration and knowledge sharing among users to maximize the benefits of BI reporting.
Common BI reporting challenges
While BI reporting offers significant benefits, there are some common challenges to be aware of:
Data integration
Integrating data from multiple sources can be complex and time-consuming.
Data quality
Ensuring data accuracy and consistency can be challenging, especially when dealing with large datasets.
User adoption
Getting users to adopt BI reporting tools and embrace data-driven decision-making can be a hurdle.
Data security
Protecting sensitive data and ensuring data security is a top concern when implementing BI reporting.
BI reporting trends
The field of BI reporting is constantly evolving. Some emerging trends include:
AI-powered analytics
Artificial Intelligence (AI) and machine learning are being increasingly used in BI reporting to automate data analysis and provide predictive insights.
Natural language processing
Natural language processing enables users to interact with BI reporting tools using spoken or written language, making it easier to explore and analyze data.
Embedded analytics
Embedded analytics allows businesses to integrate BI reporting capabilities directly into their existing applications, providing seamless access to insights.
Conclusion
In conclusion, the significance of BI reporting in today's business landscape cannot be overstated. Its role in facilitating data-driven decision-making and providing a competitive advantage is paramount. By leveraging the capabilities of BI reporting tools, organizations can delve deep into their data, unravel meaningful insights, and transform them into actionable strategies.
The sheer volume of data generated by businesses has created a pressing need for effective data analysis. BI reporting tools offer a centralized platform where disparate data sources are seamlessly integrated, allowing for a holistic view of an organization's performance. This not only eliminates the laborious and error-prone process of manual data collection and manipulation but also ensures the availability of real-time or near-real-time information for decision-makers.
Through BI reporting, businesses gain the ability to explore and analyze data across multiple dimensions, empowering them to uncover valuable patterns, trends, and correlations. By understanding customer behavior, market dynamics, and operational efficiencies, organizations can make informed choices that have a tangible impact on their growth and success.
Moreover, the user-friendly interfaces of BI reporting tools enable a wide range of stakeholders, including non-technical users, to access and interpret data effortlessly. This democratization of data empowers decision-makers at all levels of the organization to engage in evidence-based decision-making, fostering a culture of data literacy and collaboration.FAQs
What is the difference between BI reporting and traditional reporting?
Traditional reporting focuses on historical data and provides static reports, while BI reporting uses real-time data and provides interactive dashboards and visualizations.
Can BI reporting tools handle large datasets?
Yes, BI reporting tools are designed to handle large datasets and provide fast and efficient data processing capabilities.
Is BI reporting only for large enterprises?
No, businesses of all sizes can benefit from BI reporting. There are BI reporting tools available for different budgets and needs.
How can I ensure data security in BI reporting?
Implement data security measures such as user authentication, data encryption, and access controls to ensure data security in BI reporting.
Are there open-source BI reporting tools available?
Yes, there are several open-source BI reporting tools available, such as Apache Superset and Metabase.